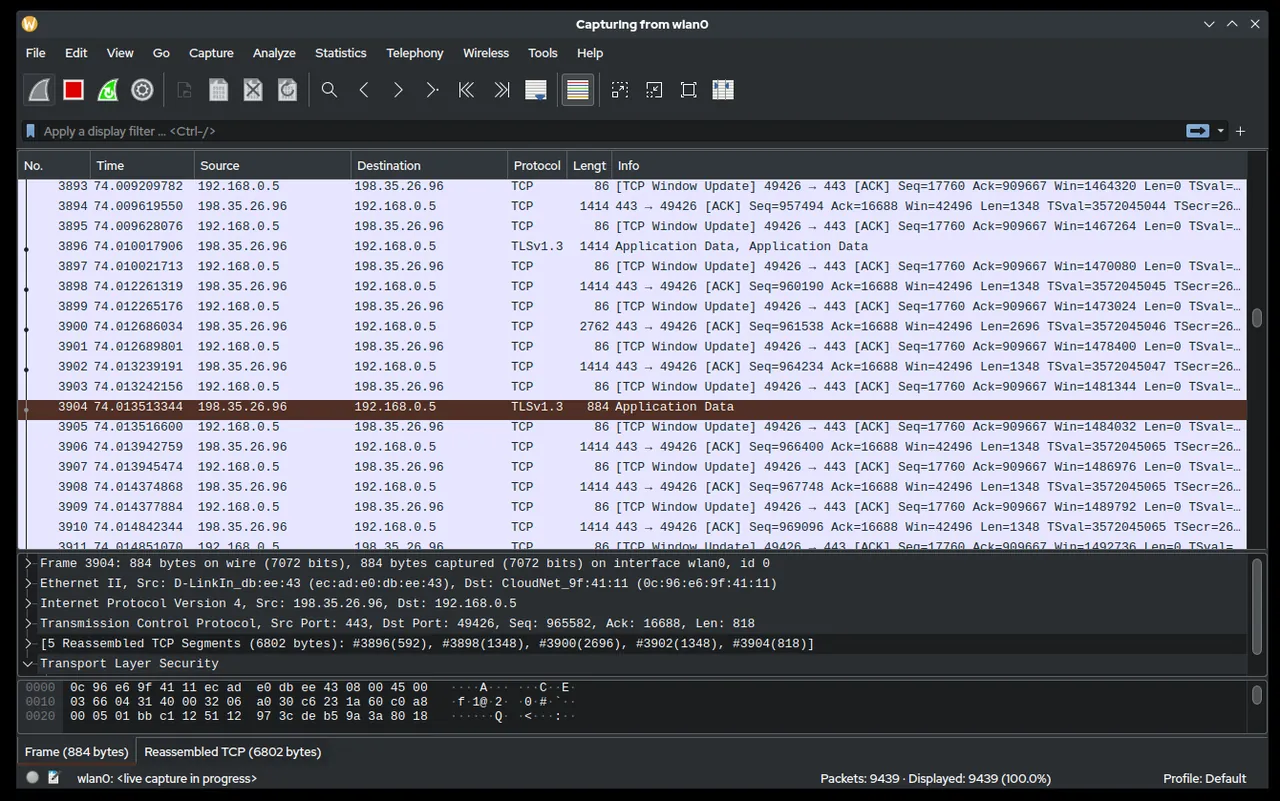
The SNMP check on a distribution switch has been timing out since Tuesday’s change window. The network team says the ACL permits the monitoring subnet. The monitoring server logs Timeout: No Response every five minutes. Both can be true at once — the request may leave from an unexpected source address, or the reply may die on the way back — and only the packets settle it. That is Wireshark’s job, and for a monitoring admin it is less a network tool than a lie detector for your own alerts.
Use with authorization only. Capture traffic only on hosts and networks you administer, under your organization’s policy. Capture files can contain credentials, session cookies and personal data: store them encrypted and delete them when the ticket closes.
What Wireshark does
Wireshark is an open-source packet analyzer, now stewarded by the Wireshark Foundation and licensed under GPLv2. It captures traffic from a network interface — or opens a capture file taken elsewhere — and decodes it with dissectors for well over a thousand protocols. The graphical application runs on Windows, macOS and Linux. Alongside it ship command-line tools that matter more on servers: dumpcap for capture, tshark for capture and decoding without a GUI, and editcap, mergecap and capinfos for trimming and combining files.
Two filter languages do most of the work. Capture filters (BPF syntax, as in tcpdump) decide what gets recorded at all. Display filters narrow what you see afterwards, using protocol fields: snmp, snmp.name, http.response.code >= 500, icmp.type == 3. Around that sit conversation statistics, I/O graphs, “follow stream” views and expert info that flags retransmissions.
Where it helps a monitoring admin
Confirming SNMP and ICMP actually reach the poller. Capture on the monitoring server with a tight filter, trigger a poll, and read the result. A request with no reply points at the path or the device ACL. A reply from an unexpected address means a device answering from a different interface than the one you configured. An ICMP port-unreachable coming back means nothing is listening on UDP 161. Each points at a different team.
# on the poller: SNMP polls, traps and ICMP errors to/from one device, capped at 10 MB
sudo dumpcap -i eth0 -f "host 10.20.1.1 and (udp port 161 or udp port 162 or icmp)" \
  -a filesize:10000 -w /var/tmp/snmp-check.pcapng
Open the file in Wireshark on your workstation. For SNMPv3 with privacy, packets are encrypted, but you can add the USM user, auth and privacy settings under the SNMP protocol preferences to decode them — useful when you suspect a passphrase or engine ID problem that the poller only reports as a timeout. Our SNMPv3 setup guide lists the error messages that usually correspond to each case.
Seeing whether traps arrive at all. If a device is supposed to send traps and your monitor shows nothing, a ring-buffer capture on UDP 162 separates “never sent”, “sent to the wrong address” and “received but not matched by any rule”. Run it with -b filesize: and -b files: so it cannot fill the disk.
Arbitrating a failing HTTP check. When a web check in Zabbix or Checkmk goes red and the application team says the site is fine, capture the check’s traffic. For plain HTTP you can read the exact status code and headers the poller received. For HTTPS the payload is encrypted, but the handshake is visible — server name, certificate, TLS alerts — which often explains the failure. To see inside, reproduce the check with curl and the SSLKEYLOGFILE variable set, then give Wireshark the key log.
Where it falls short, and who should skip it
Wireshark is an instrument, not a monitor. It keeps no history beyond the files you save, polls nothing and alerts on nothing. Capture needs privileges: Npcap on Windows, the ChmodBPF helper on macOS, or capture rights granted to dumpcap on Linux. The project’s own advice is to capture with the small privileged tool and analyze as an ordinary user, which is sound. Protocol dissectors parse untrusted input, so keep it updated and avoid running the GUI as root.
Unfiltered captures on busy links grow by gigabytes in minutes, and on switched networks you only see traffic crossing the capturing host. Reading a decoded SNMP PDU or TCP behavior takes practice. Anyone who only needs to know whether a host is up should look at Angry IP Scanner or their monitor’s own checks instead.
Who it suits
Monitoring and network admins who need evidence rather than opinions, especially where network, server and application teams are separate. It also helps when building checks for unusual devices: a capture of the vendor’s own management tool often reveals which OIDs or endpoints are worth polling.
Licensing and cost
Wireshark is free and open source under GPLv2, with no paid tier. The Wireshark Foundation is funded by donations, sponsorship and its SharkFest conferences; nothing in the software is gated. Capture drivers such as Npcap have their own license terms; read them if you plan to redistribute.
How it compares
In our network discovery and troubleshooting table, Wireshark is the tool that answers “what happened on the wire”. Angry IP Scanner answers “what is on this network”. The monitors in the same table — LibreNMS, Zabbix, Checkmk and PRTG — answer “what is the state over time”. When a capture shows a flapping device rather than a broken check, our guide to cutting alert noise covers the monitoring-side fixes.
Getting it safely
Get Wireshark from wireshark.org, or on Linux from your distribution’s signed repositories. For builds from the project site, verify them against the release’s signed hash list, which the project publishes and signs with its GPG key; on Windows, also confirm the Authenticode signature. Avoid third-party bundles and look-alike domains promoted in search ads. Our where-to-get page shows the verification commands.
FAQ
Should I install Wireshark on my monitoring server?
Usually not the GUI. Capture with dumpcap, tshark or tcpdump on the server, copy the file off, and analyze it on your workstation. That keeps a large parser out of a machine that holds credentials for your whole network.
Can Wireshark decrypt SNMPv3?
Yes, if you supply the user’s authentication and privacy settings in the SNMP protocol preferences. It cannot decrypt anything without those secrets.
Why can’t I see traffic between two other hosts?
On a switched network, your interface only receives traffic addressed to it plus broadcasts. Capture on one of the endpoints, or use a mirror (SPAN) port on a switch you administer.
Is tshark enough on its own?
For scripted captures and field extraction, often yes: tshark -r file.pcapng -Y snmp -T fields -e ip.src -e snmp.name pulls exactly what you need. For interpreting an unfamiliar exchange, the GUI is far quicker.